

Newsletter
Sign up and stay in-the-know about The Crowd & The Cloud and the world of citizen science.
#CrowdCloudLIVE After each episode's WORLD premiere in April, show host, producer, and people seen on the show participated in post-premiere roundtable discussions. Viewers like you listened in, asked questions, and were able to dive deeper into the power of Citizen Science.
Watch the recorded Facebook Live events now. Discover more about how Citizen Science is revolutionizing the ways we gather, analyze, and utilize the data that fuels scientific research, discovery, and community action.
I'm Nolan Doesken. I'm the State Climatologist for Colorado and the Founder of the Community Collaborative Rain, Hail and Snow Network, CoCoRaHS.
What was it about the 1997 flood that so intrigued you, so horrified you, that got you started on CoCoRaHS?
I already had been the assistant state climatologist in Colorado for about 20 years when a very heavy, localized storm occurred back in 1997. I knew the climate of the area well, knew the nature of heavy precipitation, but didn't expect one of the heavier storms in the history of Colorado to literally occur on the roof of my office, my home, in the neighborhood where I lived. New technologies had just emerged. The National Weather Service had their new Nexrad radar, the first radar system that gave quantitative estimates of how much precipitation is falling out of the sky. There was this great sense that technology was going to answer all of our challenges, when it came to flood prediction, flood warning.
And that evening, as the rains were falling on my home, I distinctly remember telling my children that this is what a disaster is made of, if the rain were to continue. At the time I didn't think it would. It wasn't lightning and thundering that much, so we felt somewhat safe outside. We walked over to my rain gauge which was a hundred yards or so from the house, and it was full to the top. We emptied it and went back to the house. It continued to rain and the waters were rising. The irrigation canal which goes behind our barn was filling to the top. The streets were full of rushing water.
I went back to the gauge about an hour later and it was exactly another inch. Something wasn't right! The wheelbarrow of my mother-in-law, right beside the gauge, was full to the top. I thought to myself, that's got to be more than two inches. That's when I realized that my rain gauge was leaking. I didn't know how much it had rained. I would have normally made a phone call under an extreme storm situation to the National Weather Service and told them what was going on. In this case I thought, "They've got this new radar. They're on top of things. They've got all the technology they need." So I didn't make the phone call. The combination of not making a phone call and having a leaking rain gauge, then later hearing the sounds of sirens in the background.
I got a call from the university late at night saying, "Come in. Your weather station has been damaged by extreme flooding." We heard helicopters the next morning, hovering over, the sound that always tells you you've had a disaster. I could have done something, that I didn't do, that might have made a difference. That has stuck with me ever since and we've been trying to make a difference in a small way.
What changed in Fort Collins in terms of weather observations between 1997 and 2013?
In 1997, we were totally data-limited. We knew very little about what was occurring. In 2013, data were flowing from volunteers. We had close to 1,300 volunteers submitting rainfall reports during and after the flood. We were able to have a map day by day as that storm was progressing, showing very confidently where the heaviest rains were. The National Weather Service was getting real time reports in a way that was not an order of magnitude, but multiple orders of magnitude different from less than 20 years previous, in the '97 case. It was amazing to see.
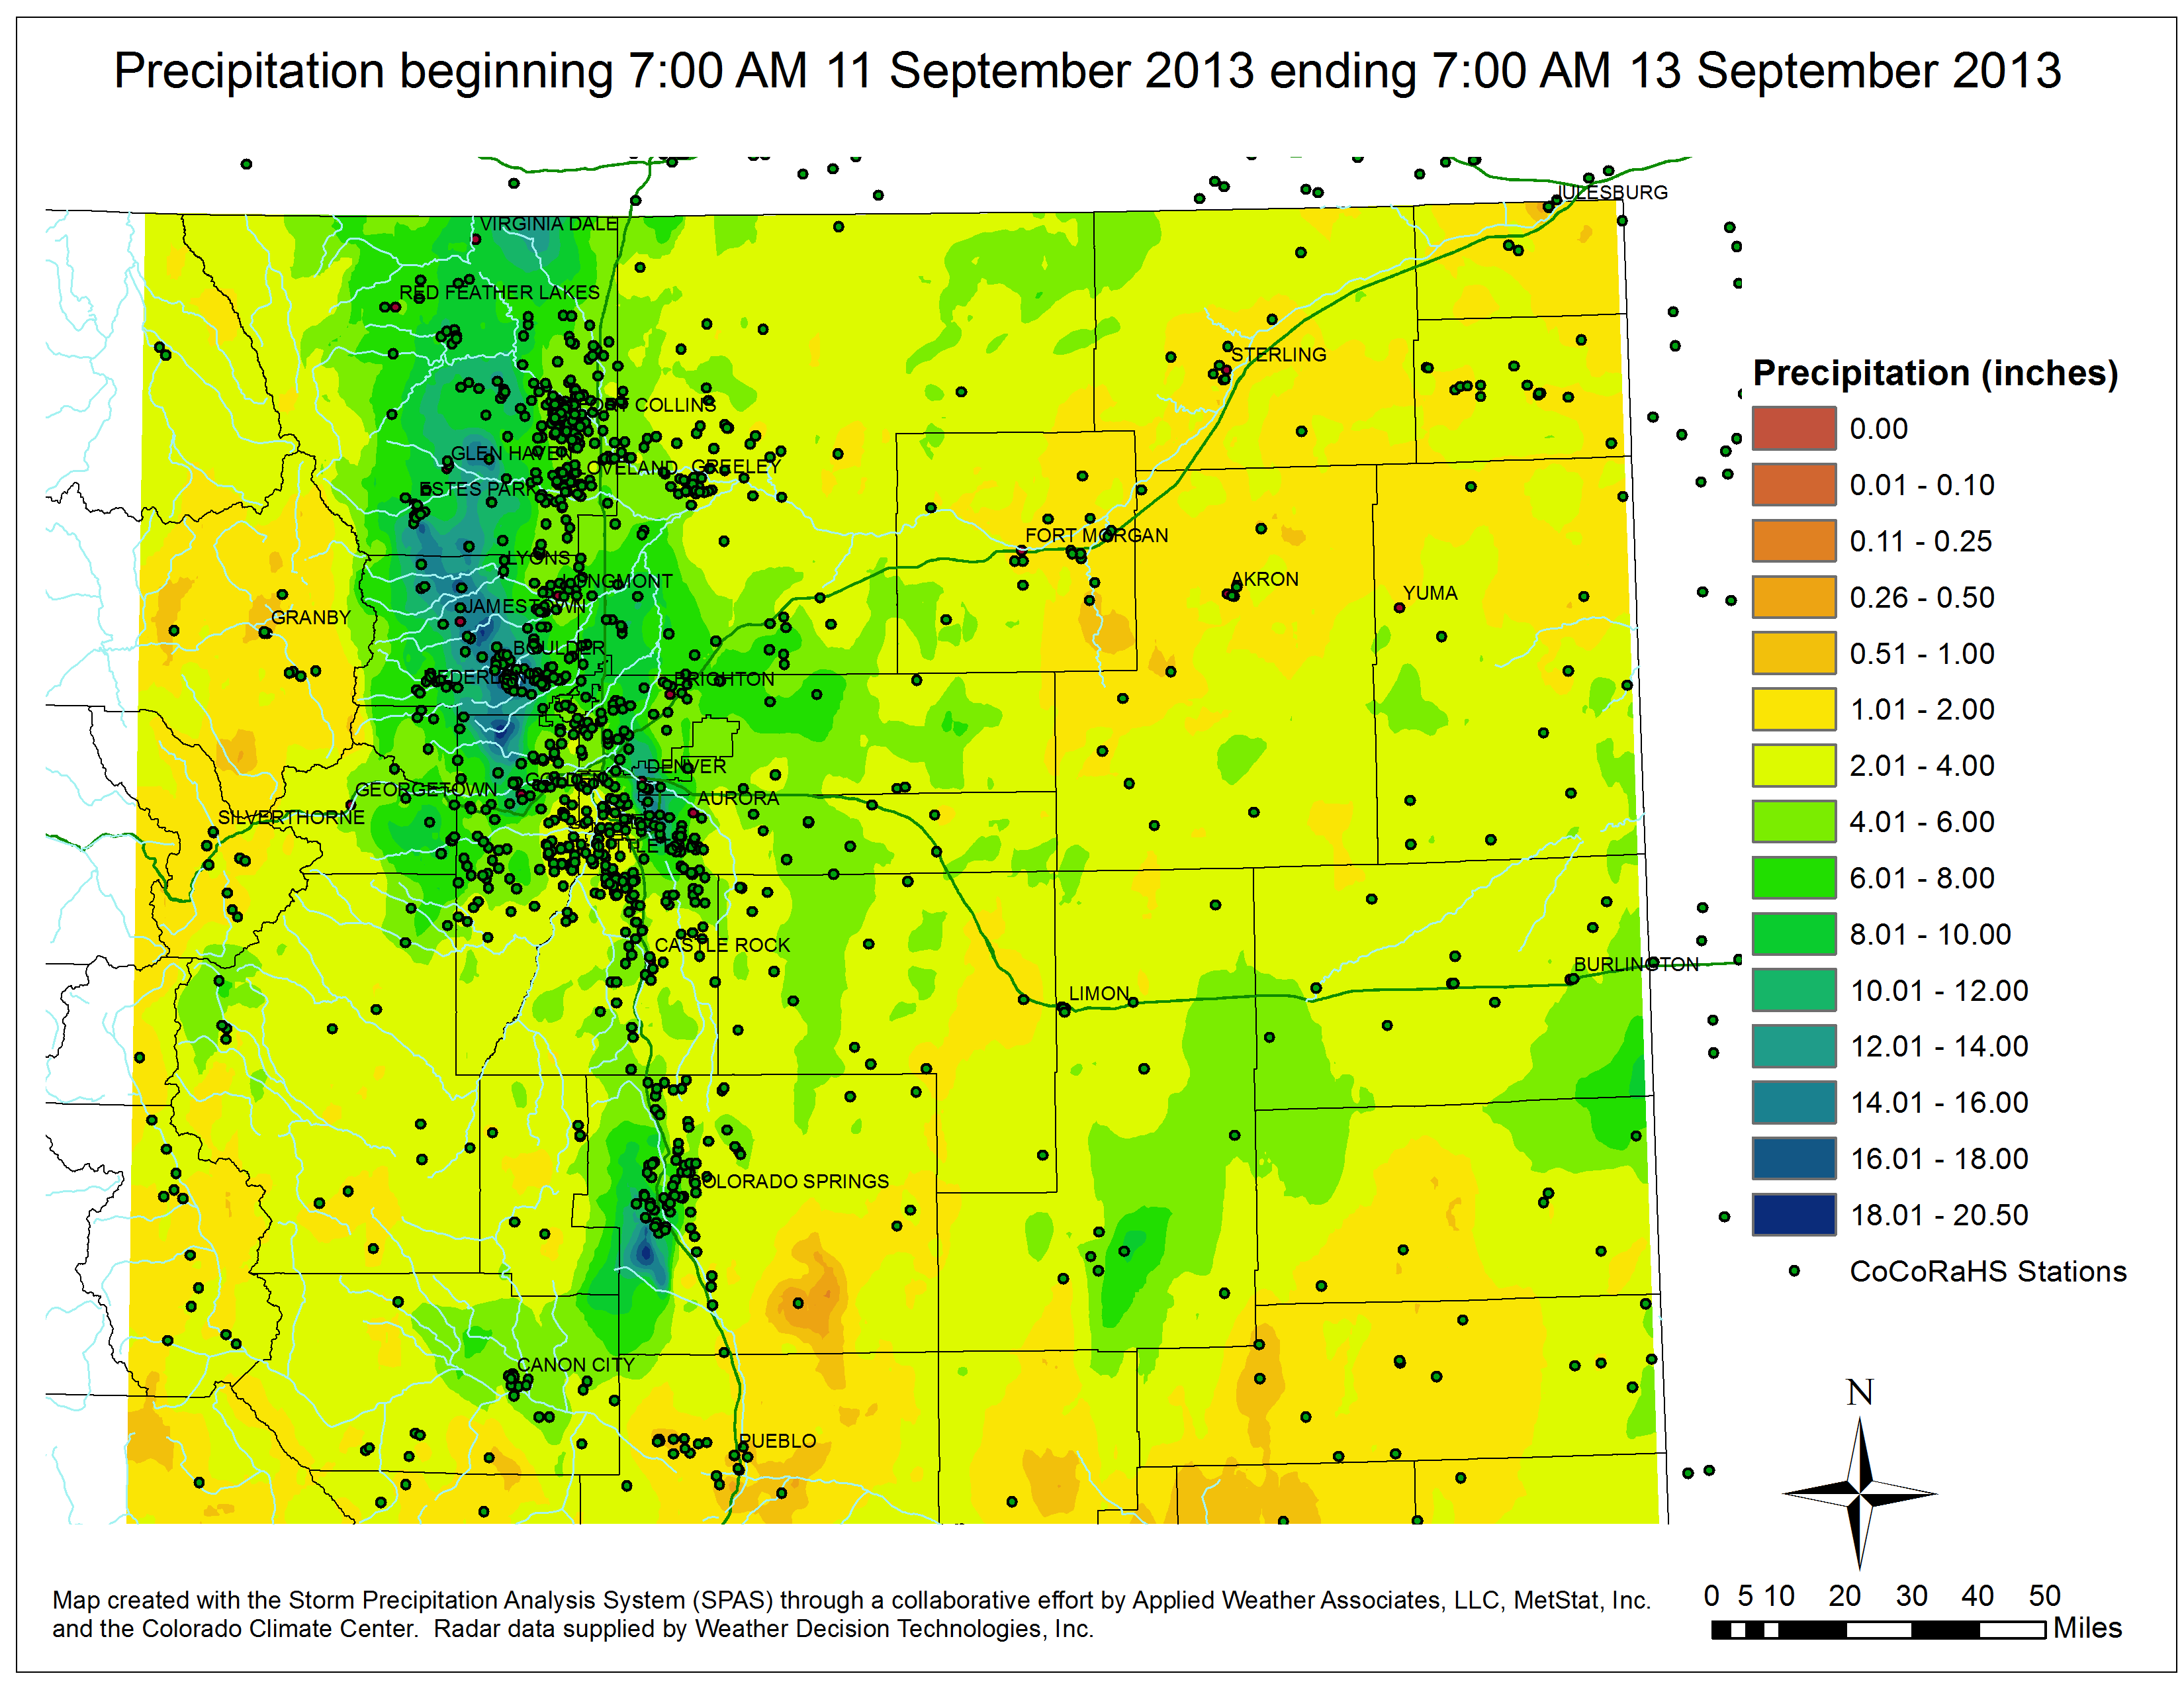
Precipitation map dotted with CoCoRaHS observations in 2013.
When we went about producing maps of rainfall in 1997, we had nothing. It took weeks. When we went about the business of documenting rainfall associated with the 2013 floods, we didn't even have to analyze the maps. The data were coming in, the maps were generating the picture for all of us to see immediately as the storm progressed. It was a totally different ballgame.
In 2013 we could all be seeing promptly where we fit in. The folks far out across the eastern plains were not caught by surprise in any way when they knew how much rain had fallen upstream of them. It was totally different, improved by a combination of technology and human participation.
What was the vision for CoCoRaHS? What does it mean?
In 1998, a year after the flood, we were able to start a very small local project. Most people who signed up at first, were the people that lived in the areas closest to the foothills, where the heaviest rains occurred. Why did they sign up? They had seen the storm. They knew what it had been like, and they wanted to be available to help if something like that happened in the future. We got every single school in Fort Collins involved that first year. Students from every single school helped out. By the end of that year, we had 50 to 100 volunteers reporting. We've been able to maintain that ever since. We had no intention of this being a state-wide, regional, or a national or international project. We were just addressing a local need. The interest mushroomed out of a storm, but then we started seeing that every storm was interesting.
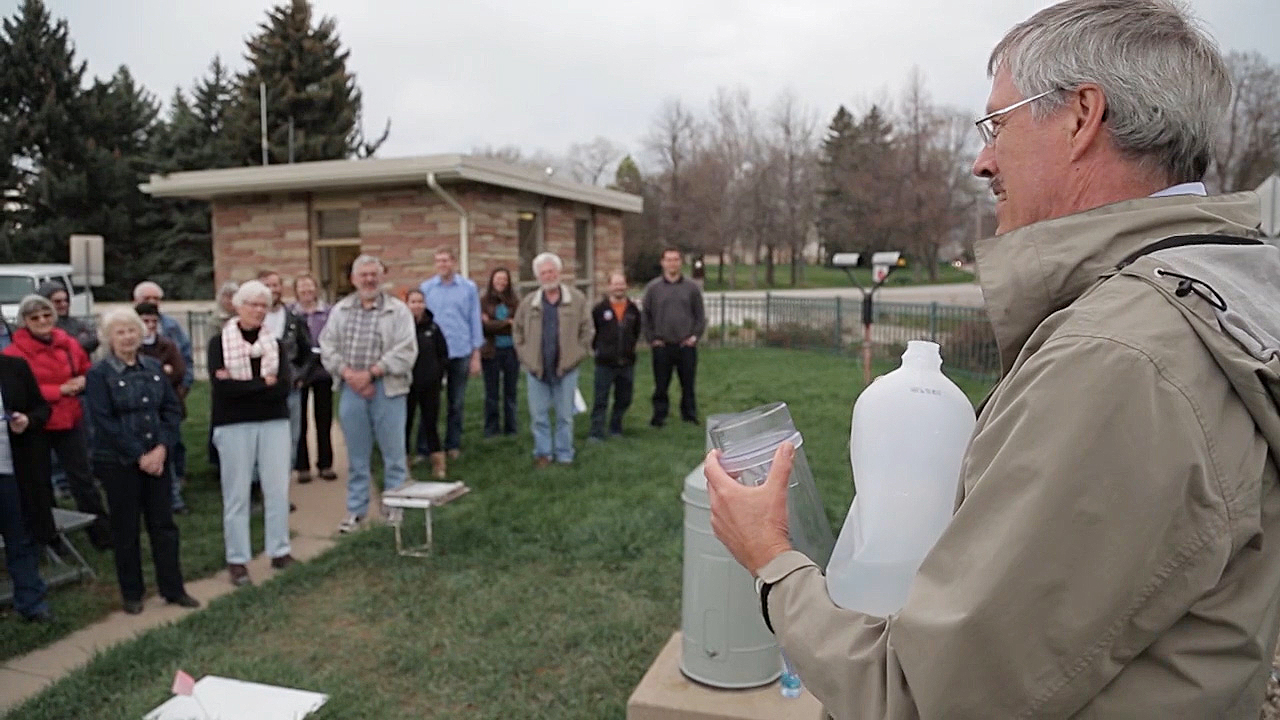
Nolan instructs CoCoRaHS volunteers on using the precipitation gauge.
CoCoRaHS was originally the “Colorado Collaborative Rain and Hail Study.” We were only anticipating studying summer storms. We were only thinking about northern Colorado. It grew, and we adjusted the acronym over time. CoCoRaHS now stands for the Community, anyone, Collaborative, working together, Rain, Hail and Snow Network. Because once we started with rain, it was literally our original volunteers who said, "Let's do snow." We had a small rebellion. People said, "If we can measure rain, we can measure snow." I knew enough about snow to say, "That's a lot harder," but they came on board and said, "We can do it." We've been trying it ever since.
CoCoRaHS today is much different than when we first started here in northern Colorado. It’s now in every state in the United States, most provinces in Canada and still expanding, some territories such as Puerto Rico and the US Virgin Islands. There have been many inquiries from other countries who would like to see something like this happen or might make their own systems happen. It's grown from originally a few dozen local volunteers to thousands. In fact, tens of thousands, in excess of 20,000 active volunteers and close to 40,000 who have participated at some point during the project, and the potential for thousands more. Every month, hundreds more people sign up to be a part.
Is the data that CoCoRaHS observers collect accurate enough to be used for the purposes that you want?
The data that are collected by our volunteers, if anything, have amazed us in their absolute scientific validity. Volunteers who get involved care. They take their measurements seriously. They want to see their information valued and valuable. It's a wonderful thing. The data quality that we have seen from CoCoRaHS is equal to or greater than what is accessible from any of the official sources. Manual measurements, which is what we still rely on, even in the technology era that we're in, everybody wants the electronic, everyone wants automated. But electronic, automated measurements of precipitation are another set of challenges. They're not quite as robust as the measurements from a committed, dedicated, fascinated volunteer. The data quality is exceptional, wonderful.
What are the strategies that you think a successful citizen science project needs to have to keep, retain, and motivate its members?
The word "community" in our acronym is a part of that. When you're on a national, international scale, it's hard to maintain that personal community. When we began, we all knew each other. We all got to like each other, mostly! We were a visible team. Now, we're much more of a virtual team, not necessarily knowing each other, but still communications is absolutely essential. Knowing what we're doing, why we're doing it, staying in touch, always encouraging and showing how the data are being used. If there's anything that makes a difference to a volunteer, it's knowing that their data are useful and needed. That is a high motivating factor.
We use the data, but we're only a part of the community of those who make use of the data being collected. Federal agencies, Department of Agriculture, National Weather Service, Bureau of Reclamation, managing water projects in the west, US Geological Survey, managing and monitoring water resources across the country. Linking the volunteers to the partners who need and use and count on that data, that's essential. But also maintaining, to the extent where possible on the scale that we're at, actual human connections, a sense that we're all alive and living, caring and thinking, feeling people. It's tough to do sometimes, electronically. We do the best we can. I'd recommend that to any other project that wants to grow past a face-to-face scale.
Is it the case that the data of an individual CoCoRaHS observer, in an extreme weather event, could ultimately help save lives?
We never know what day, what place, what time, but any observation from any of our observers could, in fact, be the observation of the big storm upstream from somebody who's at risk, that might be the report that saves lives downstream. Almost every day, there's heavy rains somewhere in the large domain that we are now covering. We have to keep reminding people that they might be the one, someday, who will make a difference, and please be ready for that day. But yes, there's so many opportunities for a single individual in the right place, at the right time, available to share their data quickly and easily, who could make a difference for many people downstream.
What can CoCoRaHS observers really give in terms of snow or water equivalent that is not there otherwise?
Snow is a more complicated beast. It varies in its water content and its density. It's blown around by wind. It's presented more of a challenge to our volunteers, but a challenge that some of them have embraced, including in some very deep snow environments. Information that is so valuable for both transportation, safety and hydrology, water supply, and flood prediction is the water content of snow. We have had volunteers diligently digging through deep layers of old, icy snow or fresh snow to identify not only how deep is it, but how much water is in that snow, and how much weight is it? Weight of snow affects structural design as well as how much energy it takes and equipment maintenance will be required to keep the snow plows functional. There's a big difference between two feet of fluff and two feet of aged ice. Our volunteers have stepped up and done incredible, heroic efforts in some very harsh environments in order to try to get useful data to help some of these applications.
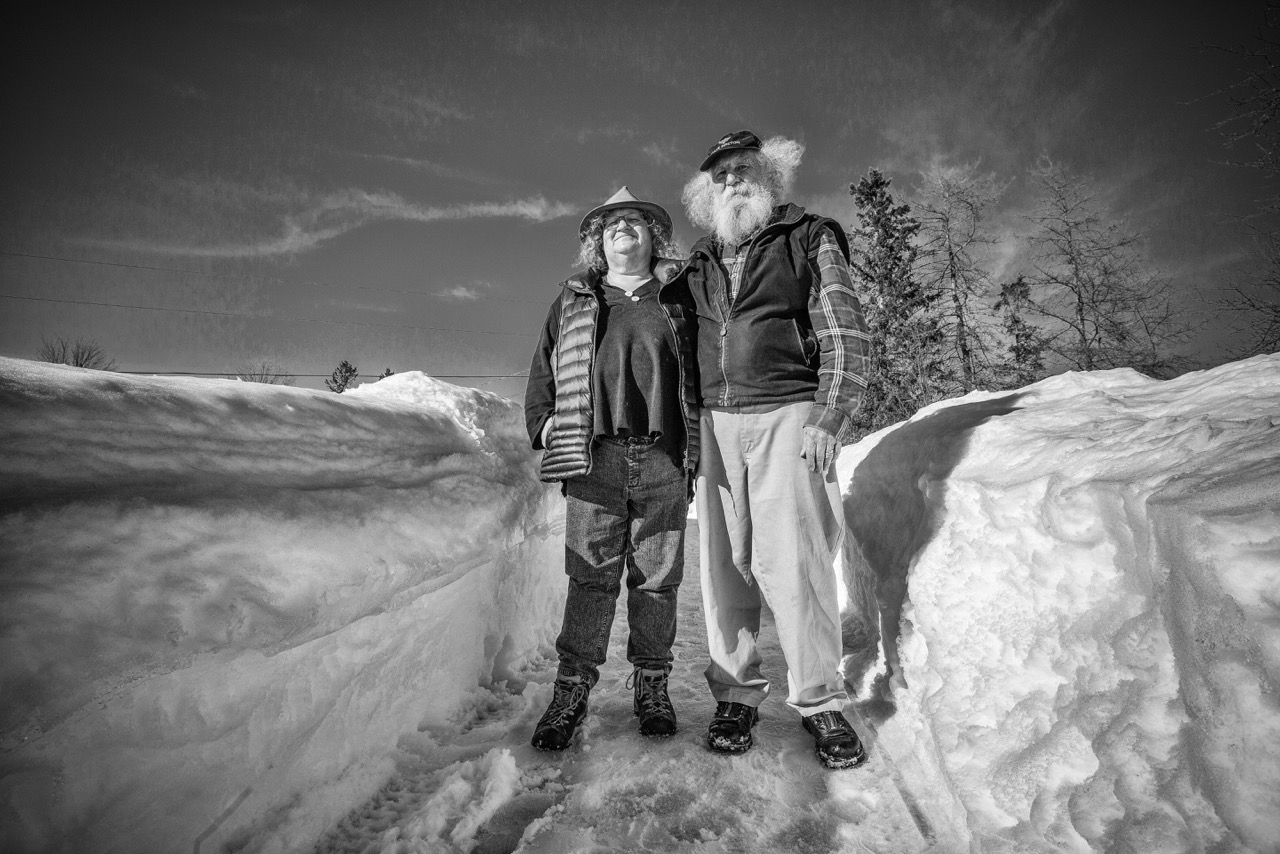
Canadian CoCoRaHS volunteers, Dan and Leslie, stand among snowbanks in New Brunswick.
What motivates CoCoRaHS volunteers to participate, especially during extreme weather events?
This is something we've learned over time, but we have discovered that if a volunteer does in fact, out of their own pocket, purchase the gauge for thirty dollars, somehow it results in a deeper commitment on their part. It screens out the many people who see "Free Rain Gauge" and come and say, "Ooh, I could do this," and then we never hear from again. But engaging both in terms of time and a few dollars seems to make a difference in the level of commitment that we see from the volunteers, and the staying power. They’re much more likely to stick with it when they've made a personal investment.
If we would have told people early on that they needed to participate in this for 10 to 17 years, at least, nobody would have ever signed up. But we find surprising numbers of those who started with us 17 years ago who are still with the project. They're just like me. They're finding every rainfall, every snowfall pattern has its unique characteristics and because of the timely ability to map and display and share and see data, we're all fascinated by every new precipitation event that occurs. It's the “Kool Aid” that we need to keep having more of every day to see, "What's the next storm going to be? What's going to happen after that? When are we going to get the really big one? What other part of the country might get it?" It's a game, in a way, because you never know what the next day is going to be for sure. And you want to be a part of that next day.
Looking back on the growth of CoCoRaHS today, what gives you the most satisfaction?
Every morning, I click on the website. I enter my own data, and then I look at the map. Every day the patterns are different. Somebody else getting rain, somebody's not, but every day, I look and say, "Those people got up and they did what I did. They went out, checked their rain gauge, and they made the effort of sharing their data. Because of that, we can all see what's happening over this whole expanse. Maybe those of us who suffered back in 1997 from a flood that we were ill prepared for, maybe we really are making a difference.
