

Newsletter
Sign up and stay in-the-know about The Crowd & The Cloud and the world of citizen science.
#CrowdCloudLIVE After each episode's WORLD premiere in April, show host, producer, and people seen on the show participated in post-premiere roundtable discussions. Viewers like you listened in, asked questions, and were able to dive deeper into the power of Citizen Science.
Watch the recorded Facebook Live events now. Discover more about how Citizen Science is revolutionizing the ways we gather, analyze, and utilize the data that fuels scientific research, discovery, and community action.
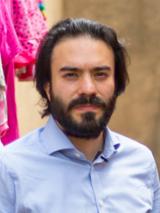
My name is Talip Kilic, I'm originally from Istanbul, Turkey. I work for the World Bank Research Department as a Senior Economist as part of the Living Standards Measurement Study Team.
Tell us a little about what you do?
In the episode, there is footage about our work in the Central and Southwestern regions of Uganda. These city wards and villages are as part of the sampled enumeration areas for the Uganda National Panel Survey (UNPS), implemented by the Uganda Bureau of Statistics, with support from the LSMS-Integrated Surveys on Agriculture (LSMS-ISA) initiative. The UNPS is a very powerful tool for applied economists, in that it tracks the same households and individuals over time, yielding a very colorful picture about their lives, about their living standards, about their livelihoods on a long-term basis. Collecting household survey data in developing countries, in countries that are predominantly rural is not easy business! It definitely requires commitment and passion for the job.
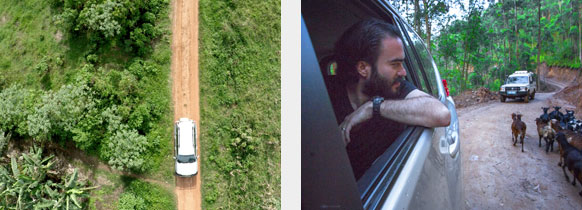
Talip journeys on Uganda's dirt roads to reach his destinations in the countryside.
What does it mean to be an economist in Uganda?
When the general public thinks about what an economist is, perhaps they don't picture a person in the fields of Uganda, overseeing household survey data collection. I'm what you call an “applied economist”, which means that I actively use household survey data to do my research. My activities in Uganda are in support of the UBOS management and field staff, specifically the design and implementation of the UNPS, which I also end up using for my own research. I spend up to 60 to 90 days a year traveling predominantly to Eastern and Southern Africa working with various national statistics offices.
Getting to our intended destinations in rural settings to be able to conduct our household surveys is really one of the most challenging parts of our job. Accessibility is largely an issue. You may have a hard time finding people. Or, you show up and the whole community simply cannot be bothered because there's a funeral. You need to respect their lives. At the end of the day the process is made difficult because you're dealing with nature, and you're also dealing with humans. They all come with different priorities and problems. You need to be able to respect their time and their availability.
The typical person may not think about an economist sitting by an enumerator conducting a structured interview on a tablet computer, collecting information every year. Then coming out of that interview and really caring about what just took place, really caring about that data. At the end of the day, I, too, am a user of that data. Whatever comes out of that interview has to be a quality product.
What is the Living Standards Measurement Study (LSMS)?
The LSMS is a household survey program at the World Bank, providing technical assistance to national statistical offices in low- and middle-income countries for the design, implementation and analysis of multi-topic household surveys. A typical survey supported by the LSMS holds the pulse of the economy, and helps us understand living standards, how they evolve over time, and what determines them. To be able to answer these deep development questions, you would need detailed household survey data that is collected accurately from representative segment of the population that you are interested in.
The creation of the Living Standards Measurement Study really dates back to the now late president of the World Bank, President McNamara, and how he was taken aback by the complete absence of poverty data for a number of countries that the World Bank was working with. The World Bank's mission is to end poverty. Today, they have two institutional goals. One is to end extreme poverty by 2030. The other is to promote shared prosperity, by promoting growth of the incomes of the bottom 40% of the population. If you have the goal of ending extreme poverty, you first have to measure poverty. The poverty data landscape in developing countries has large gaps. Large gaps in terms of availability of this data on a timely basis, and in terms of the quality of the data that is collected. For us to really end extreme poverty, we need to be able to benchmark it. We need to be able to measure it well and do that in a sustainable fashion.
What is the current state of poverty in Africa?
Here in Uganda, the poverty rate has been declining steadily since the 2000s, but when you look at the numbers roughly 20%of the population is estimated to be living in poverty. That means they don't have the minimum standards of living from a perspective of food consumption as well as their non-food needs. If you look at other countries in this particular region, you will see a similar picture. There's also a bit of diversity, both within Africa and across different contexts in the world, where you could see up to 50% or more of the population in poverty. This occurs in countries like Malawi, which is not far from here, and Niger, which is in a completely different part of Africa.
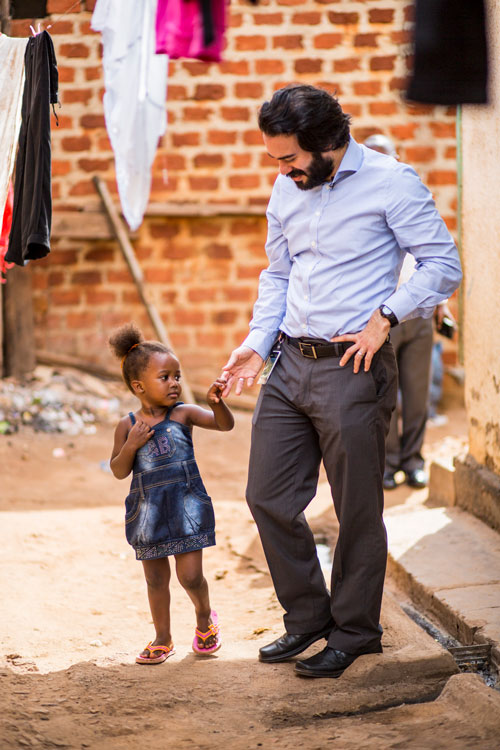
Talip walks with a young girl in Kampala, Uganda's capital.
How do you decide which people to survey? What do you survey?
The first step in terms of creating a sample for a national household survey requires a complete listing of enumeration areas in the country. Enumeration areas are basically sub-divisions within administrative units of that particular country that is driven by the spread of population. There are more than 80,000 of these enumeration areas across Uganda. The first step for a household survey is to pick a representative sample of these enumeration areas across the country. For the purpose of the Uganda National Panel Survey, we're working with approximately 300 of these enumeration areas that, based on statistical theory, give us a representative picture of what's happening in Uganda and how that's changing over time. Once you select your enumeration area, the second step is to list every household in an enumeration area, and then randomly pick from that population a set of 10 households which then give you the household sample that you interview.
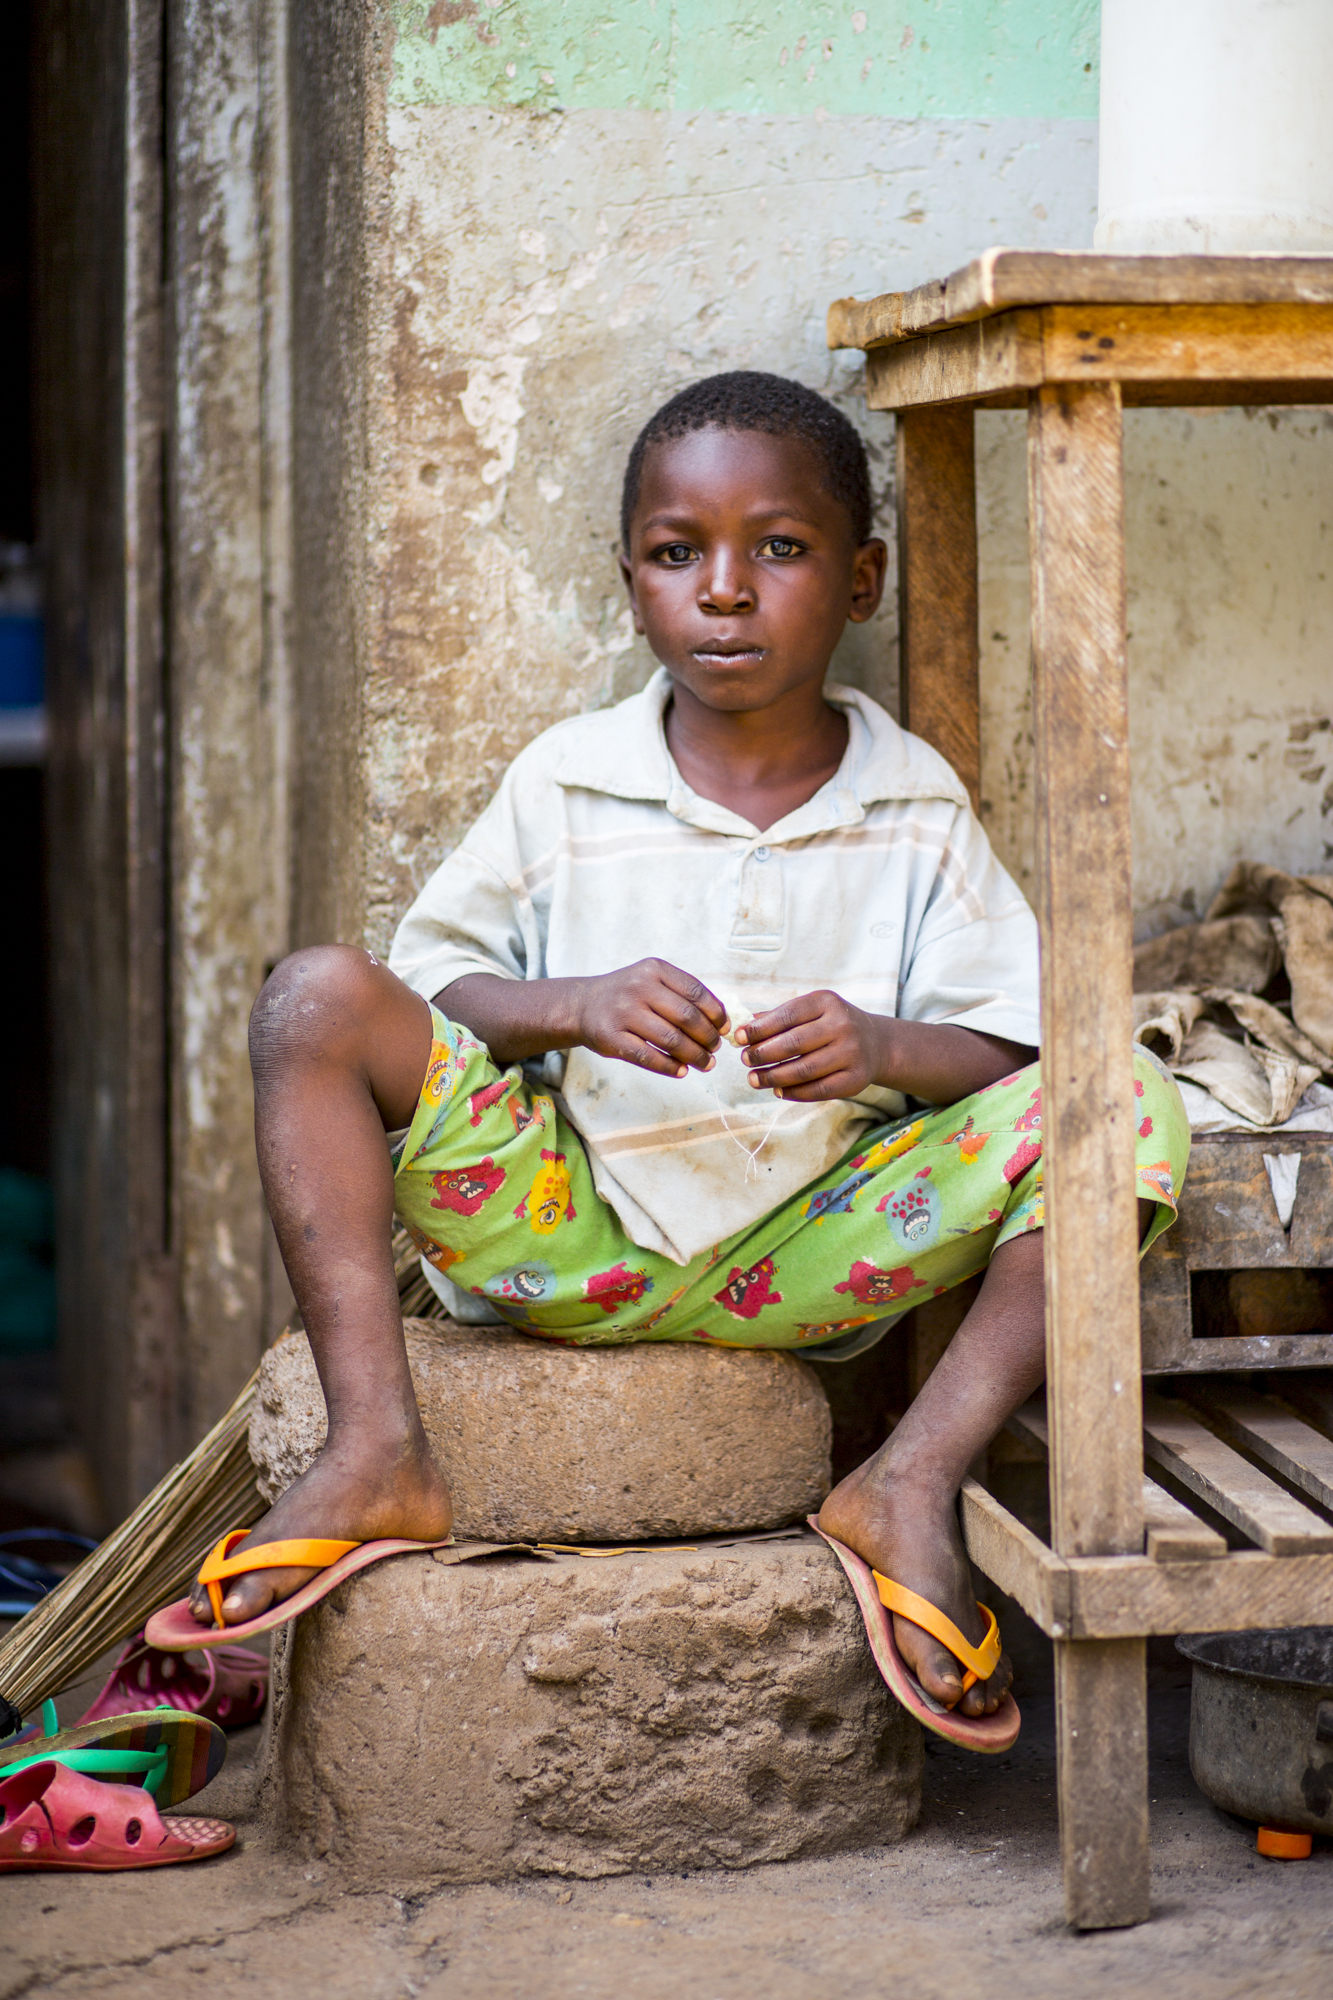
The Uganda National Panel Survey is a multi-topic tool that collects detailed information on each member of the household regarding their demographic characteristics; their education, their health, their employment. It collects detailed data on the types of food and non-food items that are consumed by the sampled households. In Uganda, we're also interested in nutrition related issues. One part of the survey consists of taking weight and height measurements of children from the ages of 0 to 59 months. With a tool like the UNPS, since it's an annual survey instrument that visits the same population, you can track the growth of these children year in and year out, and explore the underlying causes of why children stay stunted over time.
Is the information you collect from the surveys provided as open data?
The World Bank is committed to open data. That means that the data operations that we help fund or supervise need to be made publicly available. Many people and institutions need this data, including statisticians at the Uganda Bureau of Statistics, planning departments in respective ministries, economists, NGOs that do analytical work using this data. Public availability of data means worldwide availability. You have researchers all across the world that are actually benefiting from this data.
The “public good” nature of this data is a really powerful concept, because it alters the way we think about African countries and regions. Since 2009, the World Bank Living Standards Measurement Study-Integrated Surveys on Agriculture (LSMS-ISA) initiative has dramatically improved availability, and quality, of survey data on agriculture in Africa. Since African livelihoods depend heavily on agriculture, the LSMS-ISA data are changing our understanding of African agriculture, of these economies that did not have this kind of data before.
Employment data is one of the many statistics captured through the surveys.
Do you think that these data are helping people?
I would like to think so, but there is no silver bullet. The household survey data that we generate are as good as they're used. It is a process, and it's almost always linked to the evolution of the capacity that we have in the country to be able to utilize this data. To be able to use the data to hold governments and international organizations accountable for development efforts. Over time, you see a better understanding of the economy, of the choices that people are making. Of course the public availability of this data does not guarantee that the data is going to be used, it's going to be used extensively to inform policy discussions. But at the same time, the availability of quality, timely, and free data, is a prerequisite for that process to begin. The data that we generate could be used in improving the livelihoods of people that are living in poverty. We’re trying to do justice to the lives of the people that we've inquired about.
The information on land area is quite critical for a number of different reasons. Accurate information on land areas is important for policy-making, first and foremost, to understand the livelihoods of these people and their wealth. Even for basic agricultural statistics in Uganda, we need to know the amount of area owned and cultivated. Land is also one of the most valuable assets that the rural poor have access to. For us to know the actual area of the land that they're working with is quite instrumental in understanding their lives. In this context, one particular application that land area would be useful for is to understand agricultural productivity dynamics.
What do you find gratifying about your job?
One of the gratifying aspects of my job is to be able to share my knowledge and expertise with my counterparts in the Uganda Bureau of Statistics. They range from statisticians that have graduate school degrees as well as enumerators with secondary education, or university education, or team leaders that have been working here for the past 15 or 20 years. It really captures a wide range of individuals that I get to interact with to get this household survey operation off the ground. When I see over time, the capacities of these individuals evolving, getting comfortable with the data that they're collecting, with the analysis of this data, and being able to communicate what the data could do for others outside of their institution, that is a satisfying part of my job.
One of the luxuries that I enjoy as part of my job, is that I have the inside track. These are surveys that I helped design and implement, that lead me to specific communities, specific households for me to observe. Think about the larger dataset, about 3,000 to 5,000 households with thousands of individuals that make up these households. The average data user, since the records are anonymized, they don't really know the individual. They're using the data to answer a specific question. For me, it's a lot more personal. I have been to a specific household, to a specific community that is part of that dataset.
That human story that tells me how agriculture is linked to nutrition outcomes, how people make employment choices, how educated they are, whether they have access to healthcare. What determines that? Knowing the human story is a responsibility and a powerful notion for me to utilize that as part of my research to better contextualize the data findings.
