

Newsletter
Sign up and stay in-the-know about The Crowd & The Cloud and the world of citizen science.
#CrowdCloudLIVE After each episode's WORLD premiere in April, show host, producer, and people seen on the show participated in post-premiere roundtable discussions. Viewers like you listened in, asked questions, and were able to dive deeper into the power of Citizen Science.
Watch the recorded Facebook Live events now. Discover more about how Citizen Science is revolutionizing the ways we gather, analyze, and utilize the data that fuels scientific research, discovery, and community action.
My name is Meredith Barrett and I’m Vice President of Science and Research at Propeller Health. Right now, we’re researching asthma in Jefferson County, Louisville, with the hopes of expanding to a larger study area someday.
How does Propeller Health inform public policy on asthma?
Going back to the foundation of Propeller Health, David Van Sickle was very concerned with preventing asthma. We just weren't seeing any improvement in terms of morbidity and the prevalence of asthma. We felt like the best approach to do that, was with data. We try to take the data that we're collecting on individual patients and aggregate it to be able to take lessons from it that could be useful for a city, county, state, or even nationwide. We can look for patterns of asthma attacks across a region and then do analyses to try to figure out what might be driving those attacks, which can be really helpful information to inform decision making and the policy process. It can then help lead to change in transportation policy, housing or development policy, and many more types of policies.
What are “data layers” and how do you use them?
Data layers refer to the type of data that we can use to analyze what's going on with these asthma attacks, and the geographic and temporal patterns that we're seeing. We've been able to cultivate a dataset of over 40 different environmental and socioeconomic data layers. We took what we know from the literature of what we've seen elsewhere, what we've suspected might have an influence on asthma patterns. We were able to pull publicly-available data. We cultivated this huge data set of layers and combined that with our asthma data. From the asthma rescue inhaler use point, we're able to extract that from each of those different 40 environmental and neighborhood socioeconomic data layers. All of a sudden we have this incredibly rich data set that is able to capture a multivariate picture of what's going on with asthma in Jefferson County.
At first, we sliced and diced the data in different ways. We looked at the spatial patterns. We also looked at the temporal patterns. We saw the seasonal patterns in inhaler use. We also saw specific neighborhoods that had much heavier inhaler use than others. What we're doing now is the data allows us to look both spatially and temporally at the same time. We can, for example, look at how air pollutants, wind speed and wind direction on any given day in Jefferson County may influence the rate of inhaler usage.
Where do you get the asthma data for your study?
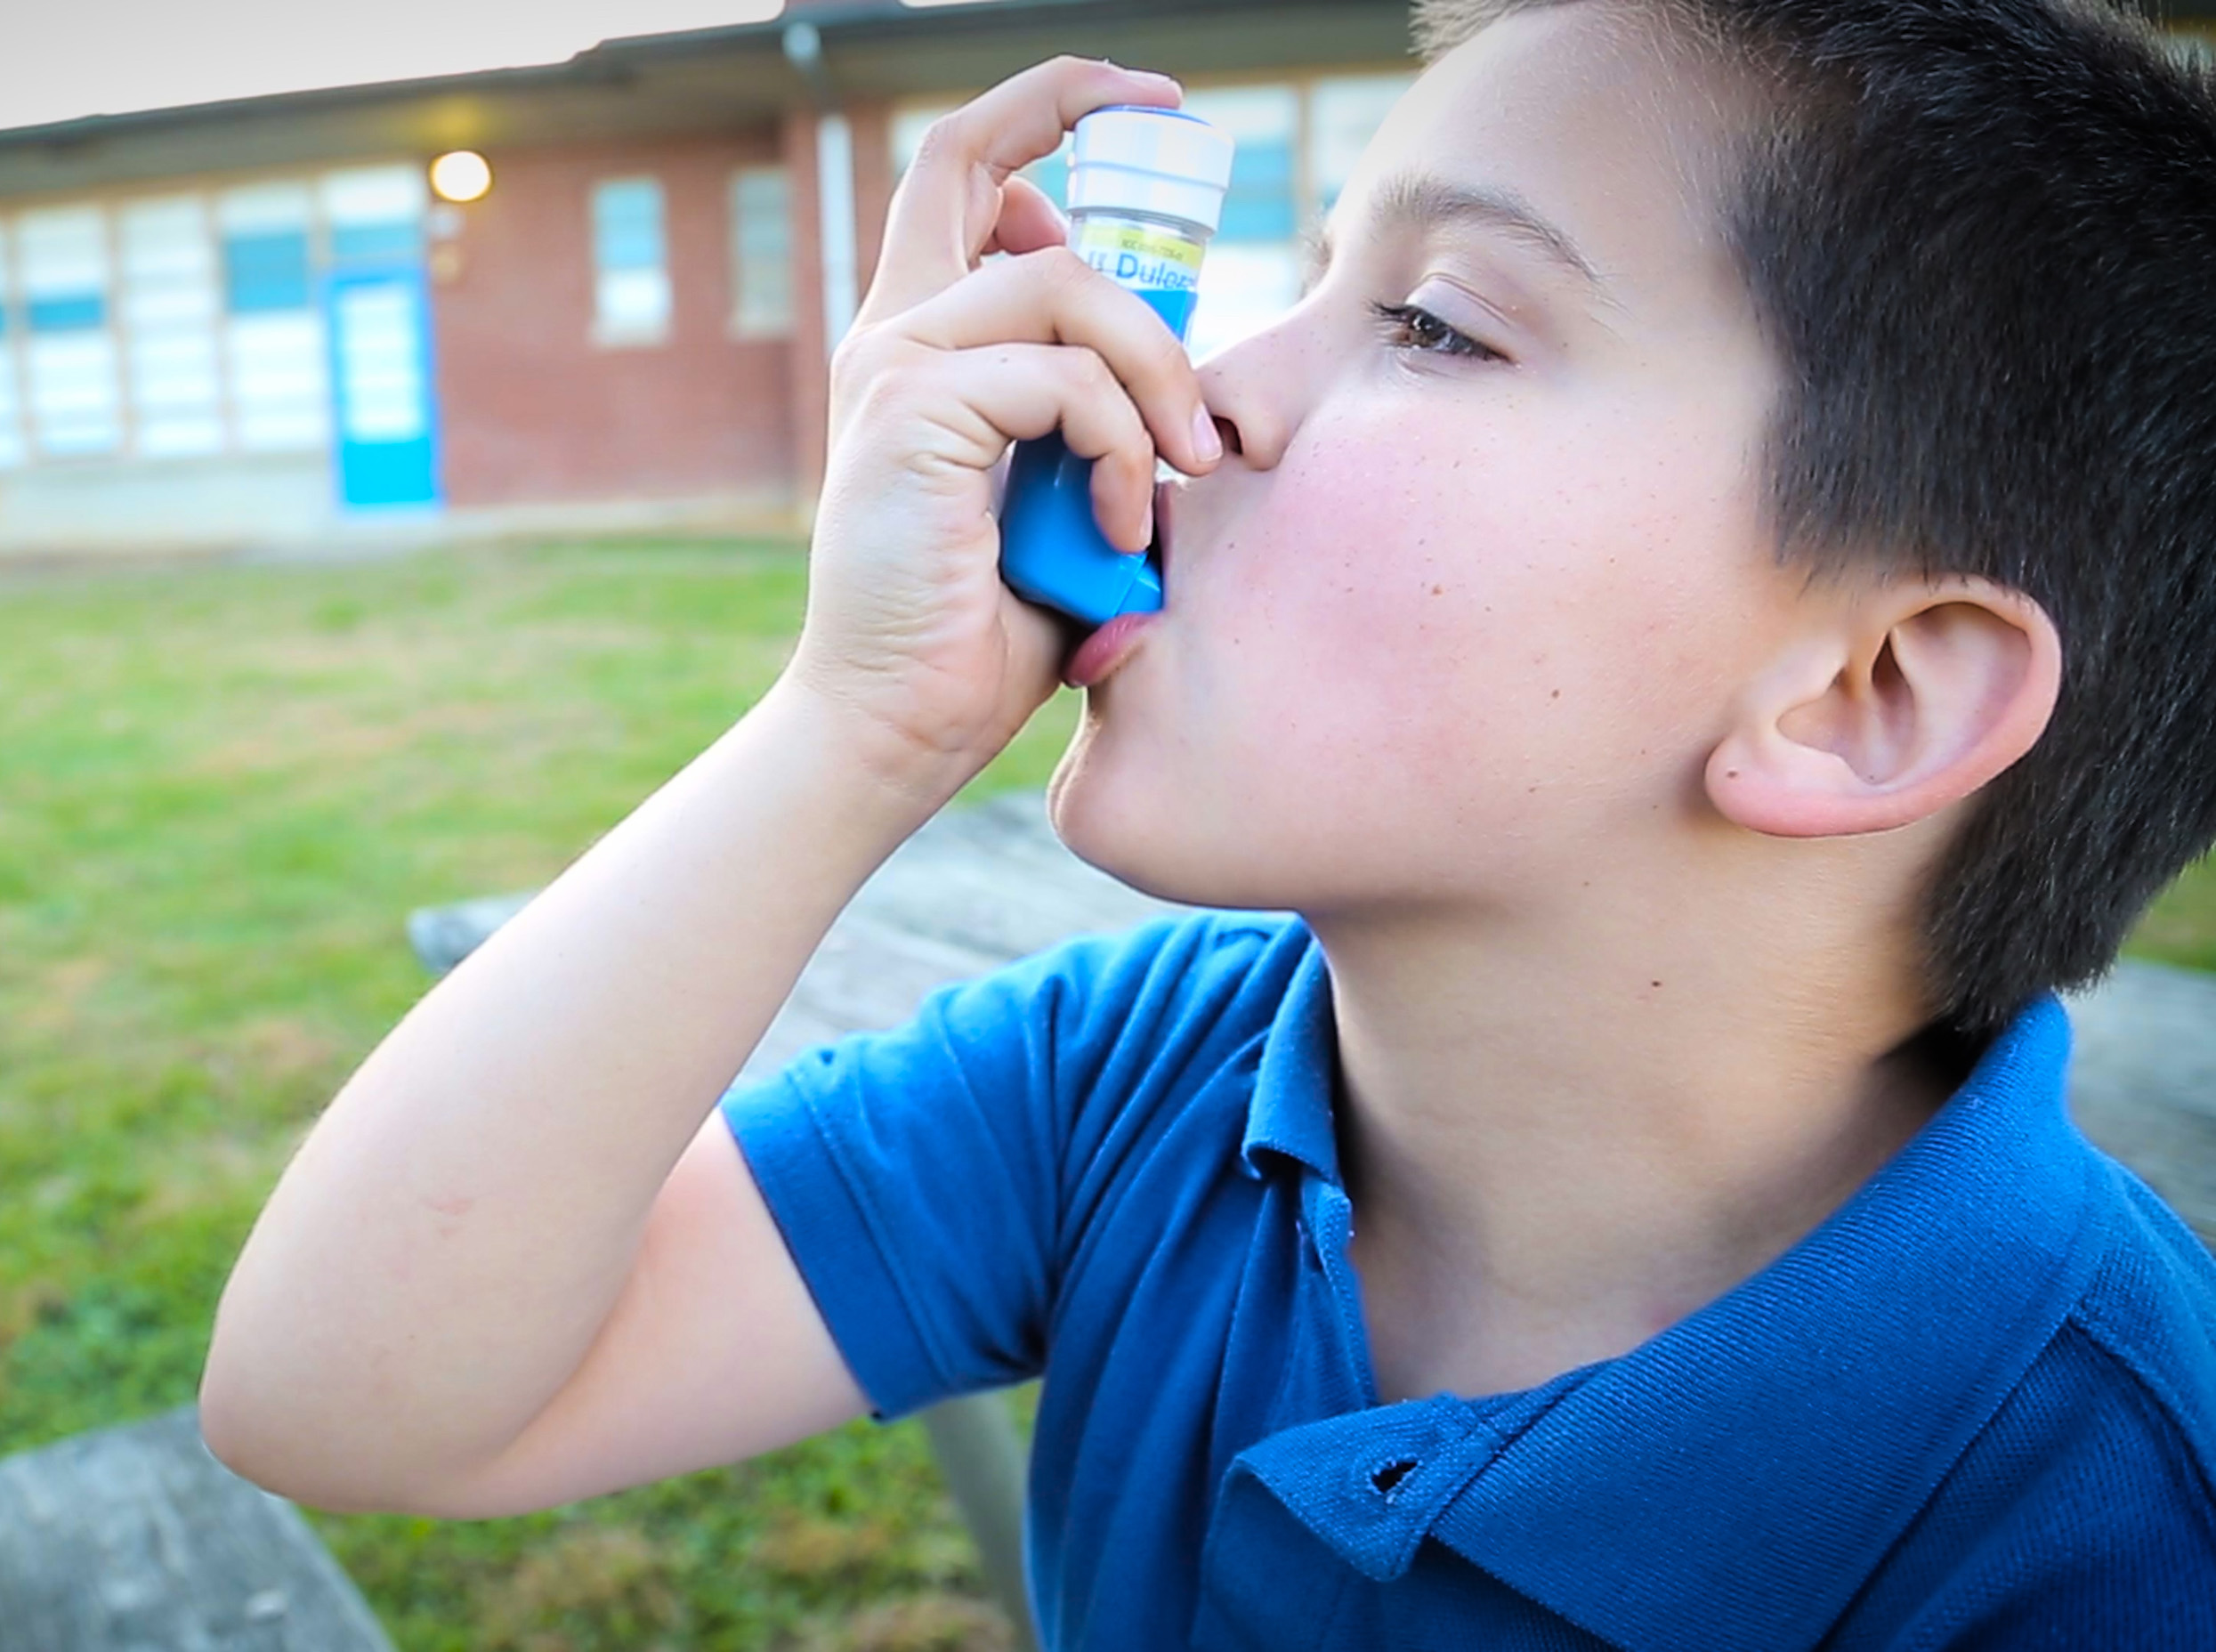
We've been running a pilot in Jefferson County for about two years, from 2012 to 2014. We enrolled just under 300 participants, local residents with asthma, all ages, all races, anywhere from age 5 to age 80. These participants were enrolled in the program, and we followed them for 13 months. Each of the participants had a sensor on their rescue medication for asthma. Every time they used their medication, we were able to collect the date and the time and the number of puffs, and also the GPS location of that use. If you think about one individual person using their medication, it might not be that many times, but when you aggregate that across 300 people over the course of 13 months, we ended up with over 20,000 individual person days of data. We're able to use each and every one of those rescue inhaler use points, and each one helps us tell the story.
How do you expect your work to change over the next year with the advent of the Robert Wood Johnson Grant?
The Robert Wood Johnson Foundation Grant has really opened up what we can do with this program. In the pilot, we proved that the data we could collect from these sensors was useful and valuable, and was able to provide us the beginning of the story. Now, with up to 2,000 residents across Jefferson County, we'll be able to get all neighborhoods, socioeconomic levels, and racial groups represented so that it really tells an accurate story of what's going on with asthma. We'll be able to develop a very, very robust data set that's never, ever been collected before.
Right now, the air quality data that we rely on in Jefferson County is from EPA monitors. They provide really important data. They have a network all across the nation, but the limitation is that there are only a few monitors across the county. It gives us a regional picture of what's going on with air quality on any given day, but it doesn't give us that micro level. It's really the micro level that will actually influence an individual's exposure and response, and could it influence their asthma attack? We want to see, on a block to block level, what air quality is doing on a minute by minute level. That will add a lot of richness to our data.
What have your data revealed so far?
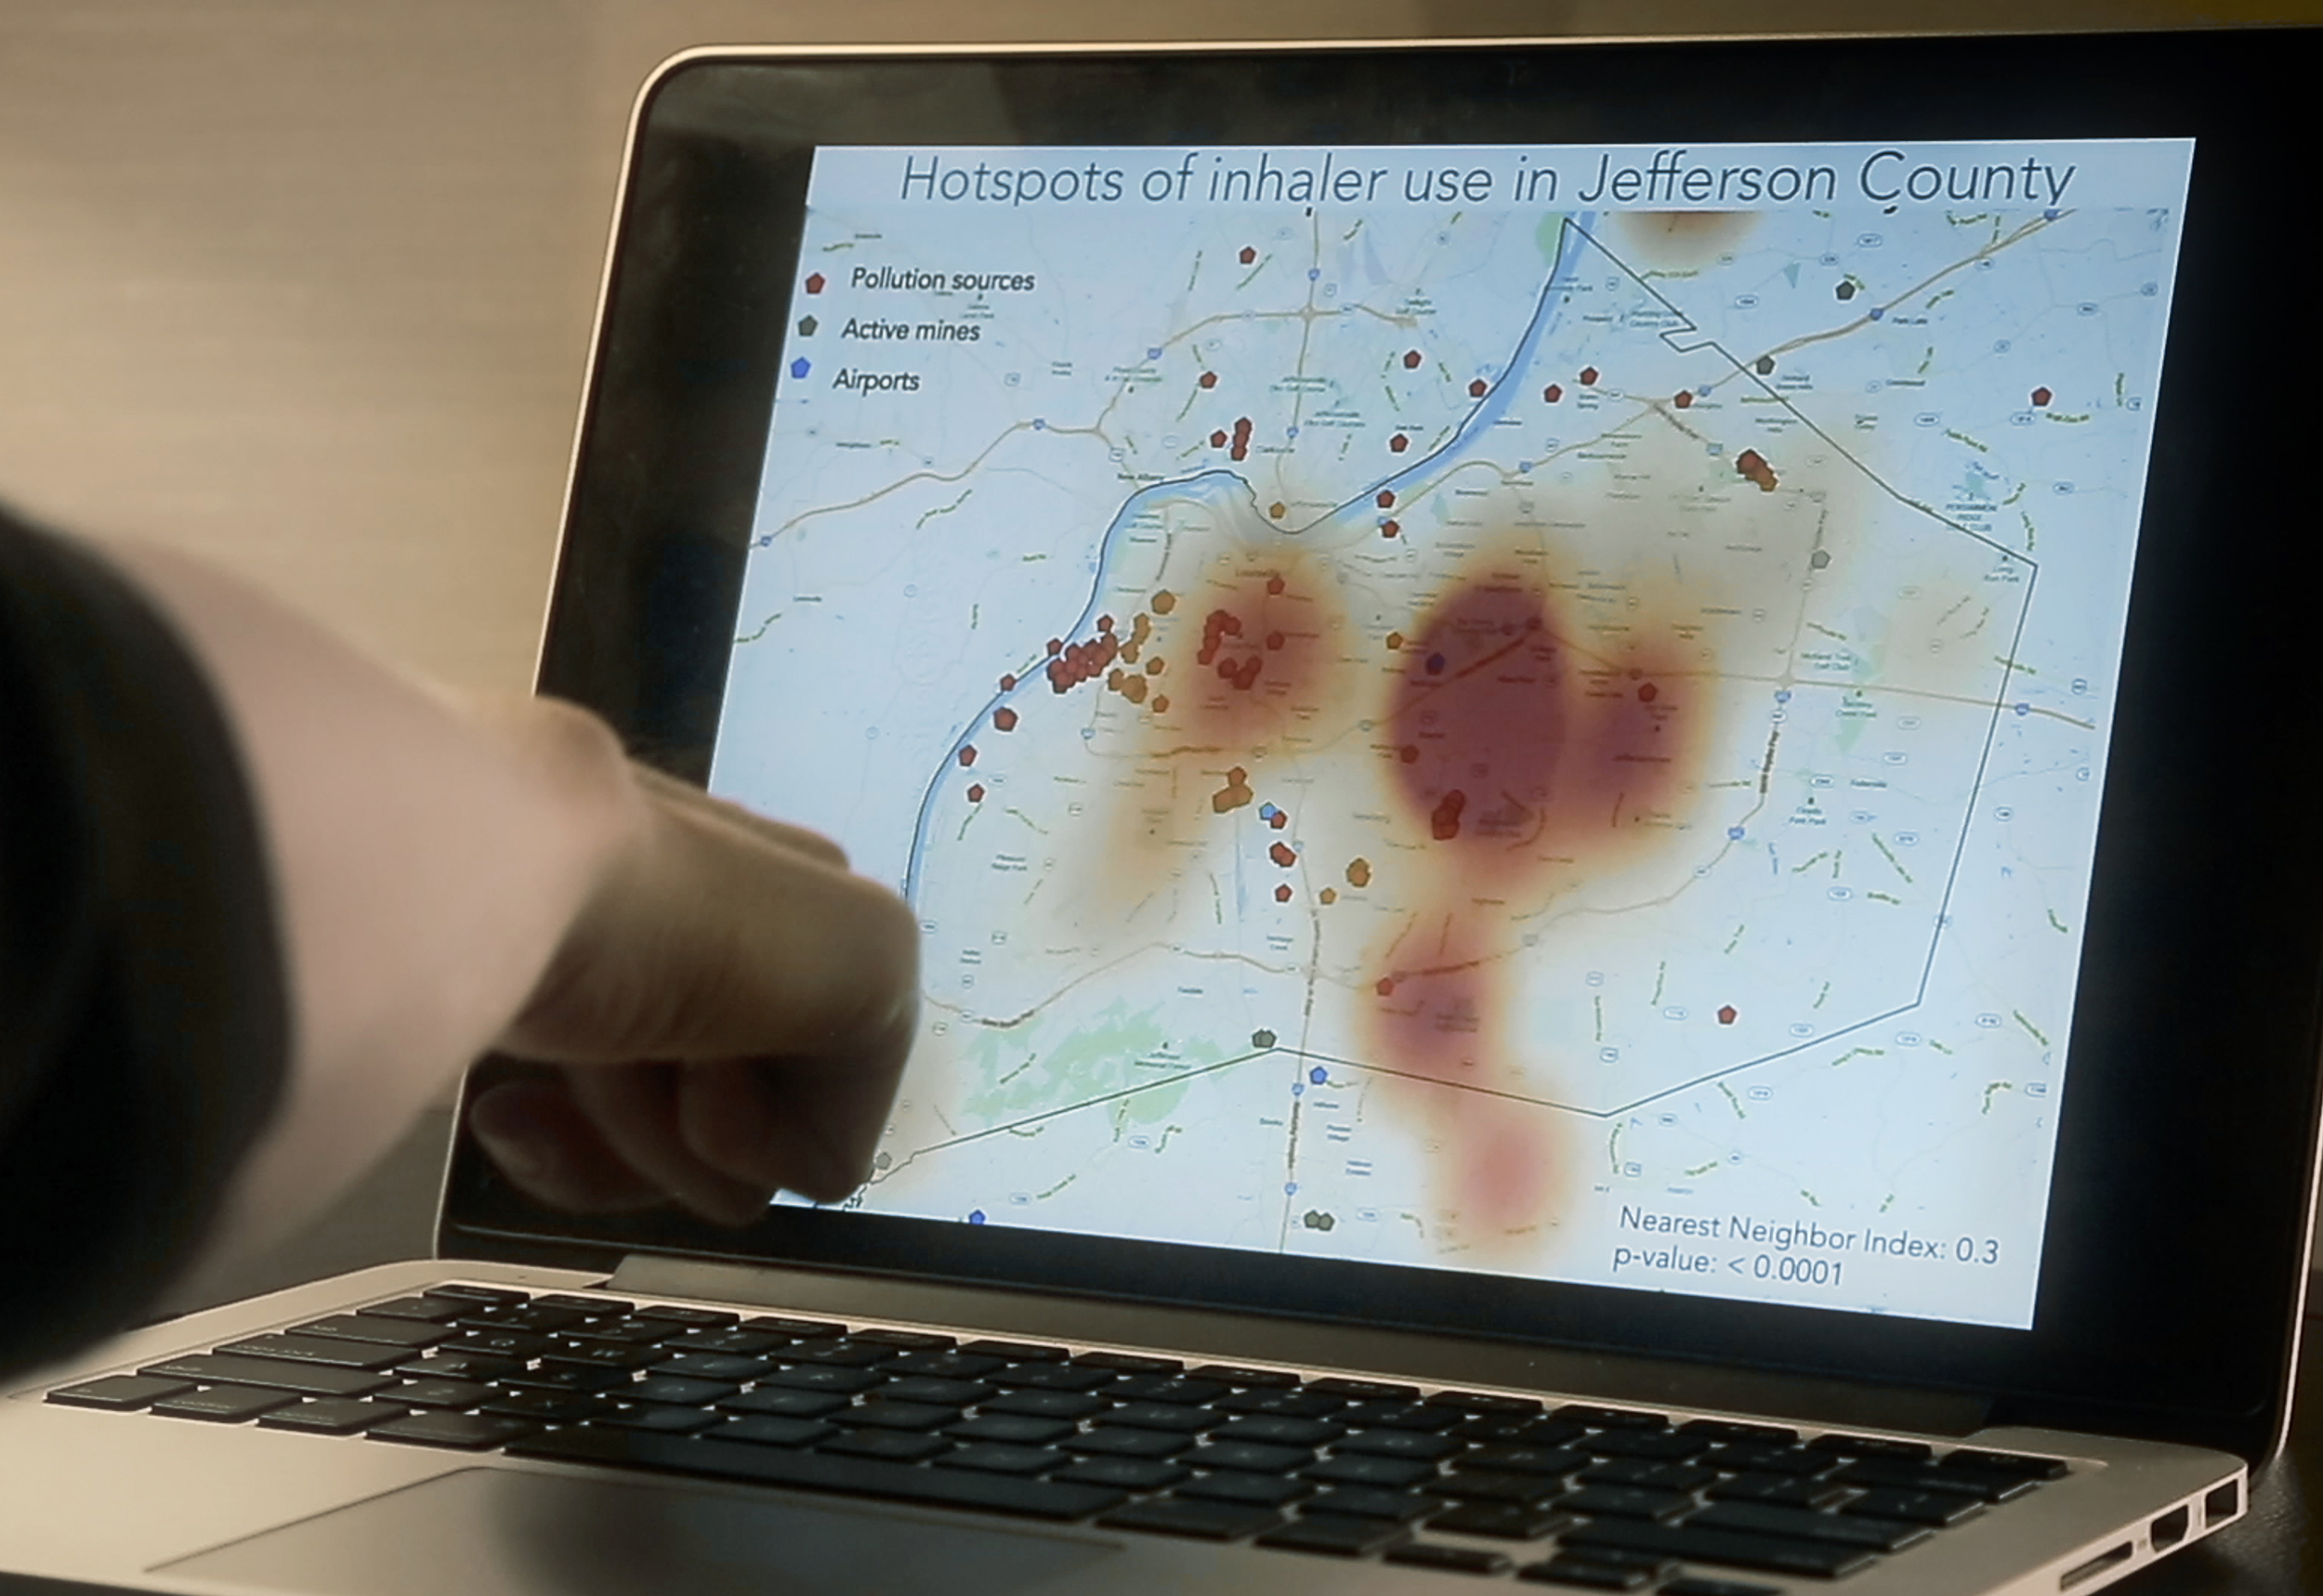
What we were able to do is take the thousands of data points that were received in the pilot and aggregate them and itemize them, and then look to see where a higher density of asthma inhaler use was more dense than expected. We did find significant clusters. Interestingly, we saw a cluster that was just east of downtown, a more affluent area, which was something that was very unexpected. We expected to see the highest density of inhaler use right near where we see the highest level of emissions, along the industrial corridor. What's interesting is that we see it's not just so simple as (the place) where air pollution is emitted, that's where you're going to see the asthma burden. It's an interplay of emissions, neighborhood characteristics, and where people spend their time as well as the impact of air quality and wind. We suspect that the wind actually is a significant predictor of asthma.
For each individual person who was in the study, we characterized the geographic distribution of all of their rescue inhaler uses. When we looked at all of the spatial data, we saw that only 31 percent of the rescue inhaler uses that we collected occurred within the home. That's almost 70 percent of the use that's happening out in the community. It really brings to bear the importance of outdoor air quality, of what the neighborhood is like, and how communities could be healthier.
Why is crowdsourced data so important in studies of public health?
I feel like we've begun to tell a story, and we have chapter one written. What we're going to be able to do by hugely increasing the number of people in the study is we'll be able to look at more seasonal trends. Public health research has been limited in the past because we've always been limited to two, three, four year old data that represents hospitalization rates in a zip code or in a county. That's really valuable data, but it doesn't necessarily show you where individuals are experiencing asthma on a day to day basis, on an hourly basis. It doesn't show you where exposures and symptoms are occurring. With this citizen science project, we have access to data that's never ever been available before. Citizen collected data can also allow us to do some predictive modeling. We can help Louisville decide what types of interventions would essentially have the biggest impact in reducing asthma in the city and in the county.
