Newsletter
Sign up and stay in-the-know about The Crowd & The Cloud and the world of citizen science.
#CrowdCloudLIVE After each episode's WORLD premiere in April, show host, producer, and people seen on the show participated in post-premiere roundtable discussions. Viewers like you listened in, asked questions, and were able to dive deeper into the power of Citizen Science.
Watch the recorded Facebook Live events now. Discover more about how Citizen Science is revolutionizing the ways we gather, analyze, and utilize the data that fuels scientific research, discovery, and community action.
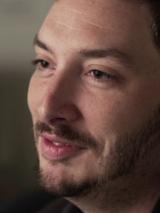
My name is Dale Kunce, I'm the Senior Geospatial Engineer and GIS Team Lead for the American Red Cross International Services Division or Department.
Tell us about OpenStreetMap...
OpenStreetMap is a free and accessible map of the world. Think about it as “Wikipedia for maps.” You can edit, I can edit it and it basically reflects the world around us. It's awesome because if your neighborhood school is not on the map, you can put it on the map. And that applies for places in Kathmandu, and it applies for places in the United States. It's a great place for people to go and share data, and it's also a great community. It's both a database and a community of people that are built around fixing the world's map and making that accessible and open for everyone.
The map that we're trying to build in OpenStreetMap these days is a living, breathing document. There are businesses that go in and out of business in a week. Maybe a road has been widened, maybe a road has been shortened, maybe a sidewalk has been added. If you map what we think would be innocuous stuff like fire hydrants and post boxes, that has downstream uses. You can build a transit or mailbox app, whatever you want, because now this open data exists.
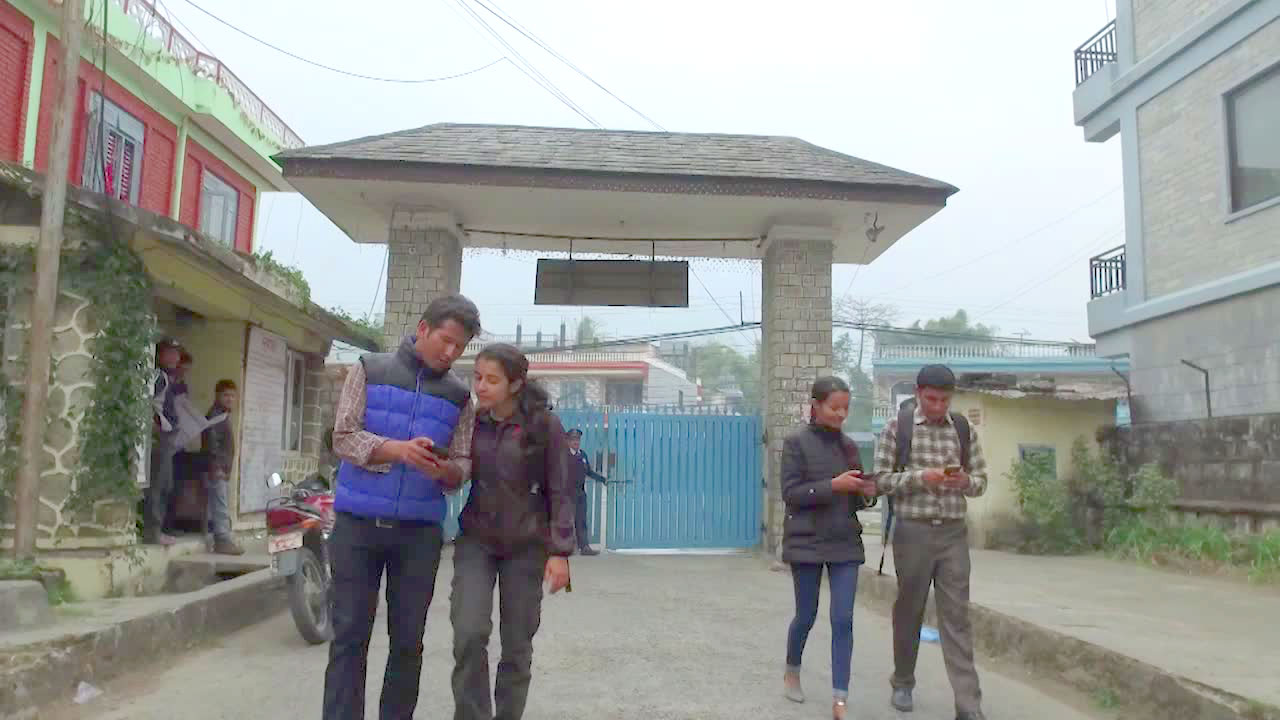
Mappers in Kathmandu walk and talk while mapping their city.
How are these maps actually made?
OpenStreetMap is built in a lot of different ways. There are tools that allow you to trace satellite imagery, over top of the buildings and roads that we see; so we add meaning. There's also tools that allow you to just walk and talk down the street. When you get home, you just play that recording into a piece of software and you can add that to your map. You can also just map from your iPad clicking and adding a place in 4Square. If a place does not exist, it puts it right into OpenStreetMap. There's many different ways to edit the map and many different people can contribute. We've had over 2 million people, and I think it's getting close to over 3 million people signed up to edit OpenStreetMap. These are people in 180, 190 countries around the world. If you can dream about a tool that would make OpenStreetMap editing easier or a device that would make OpenStreetMap easier, people are already doing it.
Can you describe what field collection of data is like?
The beauty of OpenStreetMap is that it's a project for everybody. Some people really love to go hiking, so they use a GPS device to collect data on the trail they walked that may not exist in a map. There are other people that live in cities that are really into mapping pubs, daycares or whatever. They'll walk the streets and maybe go walk a different neighborhood every time. In Washington DC, there's actually a get together where a bunch of mapping people, we do this all over the world, but in DC we like to come together and map what we call “Great Streets.” These are big corridors where people go out at night or there's nice restaurants, a lot going on. Also neglected streets about to get a lot more investment or just got a lot of new investment and the map needs to be updated. We'll go with clip boards and all the kind of crazy devices you can imagine, map for a couple hours and then have a beer.
At the Red Cross when we go do field mapping, it's a bit different. We're going places where it's a 10-hr drive from the airport. We have to be very careful about when in the year we go because we may not make it there. We take all the tools we need to empower the community to be able to do the mapping. We usually lead a week long training course on very basic stuff, Iike how to type on a computer. Then how to do the mapping and understand when you see a building, what that building means. Is that a school or is that a church? People in the community know what it looks like, I don't know what it looks like. I learn. We also want to know about the building quality. What are the building materials? We work with the community to define what those things are, and to figure out how we're going to put it into the map.
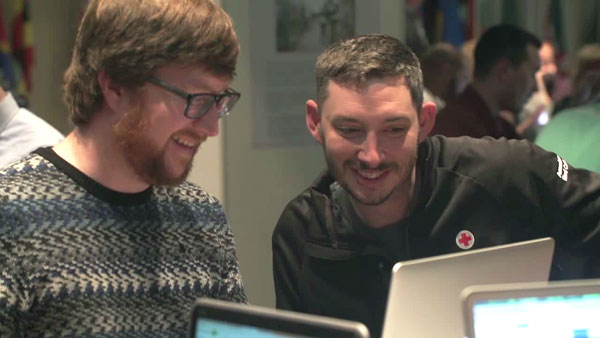
Dale collaborates with a fellow mapper at a Mapathon.
Then we actually go out and we do the mapping. And when I say map, I mean every building, every sewer drain, every fire hydrant, every telephone pole, everything about that community that allows the Red Cross to be able to do our work. All of that data is super useful because we're in the business of reducing human suffering. And reducing human suffering is key because you have to look at that in different ways. It's not just the disaster happened and now we're trying to help people. A lot of times we're trying to help people before the disaster happens. That's where a lot of our mapping is targeted, we know something bad is going to happen. We can help people move out of a floodplain in Dar es Salaam, or we can help people build better structures in Tanzania so their health quality improves. We’re a little bit smarter when we use maps.
Do you feel like the world is a really small place with your job because of all the places you’ve seen?
We were joking about this in the office the other day: the world is actually a bigger place than we thought. Before joining the Red Cross, I backpacked through Europe. But now, after joining the Red Cross and doing these projects, seeing the sheer scale of what we have to do, the world is a humongous place. The world is a humongous place that is incredibly interconnected. I can talk to people in Botswana in five minutes, right? That's not a big deal. Actually helping people in Botswana is a much harder thing than making a Skype phone call or connecting them to the internet.
What’s a “Mapathon”?
Mapathons have many different names, sometimes it's “MappyHour”, that's actually one of my favorites. Sometimes there's “Mapternoon” where a whole bunch of people get together on Saturdays and map virtually from around the world. What happens at one of these events is that a group or an individual feels inspired to host a Mapathon and teach more people about how to do it. We have events where there's five people, we've had events where there's 250 people, and we've had events where there's 900 people! It's an event that can scale along with your Wi-Fi. Wi-Fi is the limiting factor, not chairs and tables, or volunteers for that matter. Because it's a great way to spend an hour, talking with your friends, eating some free pizza and learning about humanitarian work. You're not going to be the one that goes and gives somebody a shelter kit in the Philippines after a typhoon, but you can help map their community make it easier for the Red Cross.
I've mapped everywhere. Both using satellite imagery and actually physically being there. And then like you feel like you travel to these places. I feel like I know what South Sudan looks like even though I've never been to South Sudan. I know what the buildings and construction materials in Liberia look like because I've been staring at them for hours basically from space.
Where has this mapping been used in the past and how has it helped in these various situations?
Humanitarian mapping really dates back to 2004 with the Boxing Day Tsunami in the Indonesian Ocean. When that earthquake and then later tsunami hit, it took weeks for actual maps of any value to be made and for people. There's this very famous story of a gentleman deploying with a map that was 50 years old, the best map he had for Banda Aceh, Indonesia. Banda Aceh, Indonesia does not look like that anymore, nor had it in the last 20 years before the tsunami happened and 30 foot waves rolled over everything.
Fast forward to 2010, the Haiti earthquake, and now OpenStreetMap existed, (and) there was a bunch of people that were impassioned to do their little bit. The earthquake happened and immediately 600 volunteers from all around the world started mapping in Port-au-Prince. If you look at the early maps of Port-au-Prince, my favorite is in Google, at that time was just one line. Then very quickly the map filled out, in a little over a month or so, there was about a million and a half edits.
Before and after images of Haiti and the Philippines.
Fast forward again to 2013, three years later Typhoon Haiyan hit the Philippines, hitting the Taytay Island and Tacloban killing 6-7,000 people. It was very, very bad. The storm was so big, we could see it coming, so humanitarian mappers started mapping two days before. Over the course of the next two months, 1,800 people contributed 4.5 million edits. So we're seeing this growth. And for the first time you see in Haiti, from the growth from Haiti to the Philippines, you see groups like the Red Cross were actively being participants in where people should go map.
Fast forward again to the 2015 Nepal Earthquake. There's been a lot of effort mapping in Nepal for many years now with Nama Budhatoki and Kathmandu Living Labs. The World Bank and the Red Cross has been mapping schools there and doing some great work. But then the earthquake happens. We went to 2,000 mappers in the first 48 hours and we were doing a million edits a day to the map of Nepal. We basically made the map of Nepal 15 times bigger. It happened overnight. And the relief agencies, the government, Red Cross, the other NGOs were using the data because it's the best available. Kathmandu was awesome because we had Nama. The local government agencies went to him and said, "Can you help us? We need a map of this area." He would help them print out that map of that area.
Are you addicted to mapping?
I am a full-on Mapaholic. There's maps in my office, there's maps in my house. My son is 4 and I started teaching him the continents when he was 3. We're now onto the 50 states. And learning everywhere I travel with the Red Cross, we sit down before and after I go so he can see where it is on the map and draw the line to see how far it is away, count how many time zones I cross. I love everything about maps.
This past summer I went on a very long family vacation that was long overdue. We went to basically every Northeast state from Washington DC all the way to Maine. And the entire time I mapped. On long flights I download data so that I can map. We drove up Mt. Washington in New Hampshire and I was very excited to be the person that mapped Mt. Washington. Nobody else had done it before!
When people that have never had a map, see their community or house on a map, I love that passion reflected back in our work. And that's the thing that sort of keeps me going, no matter if it's a very long day working for 20 hours after a disaster or something. Knowing that somebody in the field is going to look at the map for one second, make a decision and move on. That one second made their job 10 minutes easier. That for me is an exciting thing.
What’s next for OpenStreetMap?
OpenStreetMap has been around for awhile, but it's still in its infancy. It's still a community driven project. So I think the next thing for OpenStreetMap is a blending of community and institutional interests. Because our goal is to put people on the map. We're all marching along to the same goal, just like Wikipedia is trying to capture the world's information, we're trying to capture the world's map information. The next thing is just more adoption. We're already seeing OpenStreetMap in places like Facebook and in Apple Maps. It's already permeating into our culture and into the way that we use data and devices.
The next thing is that we're trying to map the world of wrong for people. So we're targeting a very small group of the world, we're trying to put those people onto the map to empower them to keep mapping themselves. We're going to keep targeting the hardest to get to and the hardest to get on the map. We're going to keep empowering them with digital and paper tools so that they can advocate for themselves and affect change.
